SP500 LDN TRADING UPDATE 8/9/25
.jpg)
SP500 LDN TRADING UPDATE 8/9/25
***QUOTING ES1 FOR CASH US500 EQUIVALENT LEVELS SUBTRACT ~10 POINTS***
***WEEKLY ACTION AREA VIDEO TO FOLLOW AHEAD OF NY OPEN***
WEEKLY BULL BEAR ZONE 6440/50
WEEKLY RANGE RES 6556 SUP 6407
SEP MOPEX STRADDLE 186.6 POINTS - 6260/6639
SEP EOM STRADDLE 178 POINTS - 6282/6638
DAILY VWAP BULLISH 6467
WEEKLY VWAP BULLISH 6409
DAILY BALANCE - 6452/6541
WEEKLY BALANCE - 6362/6541
MONTHLY ONE TIME FRAMING UP - 6239
Balance: This refers to a market condition where prices move within a defined range, reflecting uncertainty as participants await further market-generated information. Our approach to balance includes favoring fade trades at the range extremes (highs/lows) while preparing for potential breakout scenarios if the balance shifts.
One-Time Framing Up (OTFU): This represents a market trend where each successive bar forms a higher low, signaling a strong and consistent upward movement.
One-Time Framing Down (OTFD): This describes a market trend where each successive bar forms a lower high, indicating a pronounced and steady downward movement..
GOLDMAN SACHS TRADING DESK VIEWS
STILL ROOM TO RUN HIGHER
FICC and Equities | 6 September 2025 | 8:54 PM UTC
“We are all apprentices in a craft where no one ever becomes a master.”
– Ernest Hemingway
The S&P 500 closed at an all-time high of 6,502 on Thursday, marking the 21st record high this year. Despite this milestone, a notable segment of institutional investors remains skeptical of the rally. Conversations with long-term investors reveal lingering concerns over geopolitical instability, tariff uncertainties, and elevated valuations as key reasons for staying cautious and largely on the sidelines. Many are waiting for a market pullback that could present a compelling buying opportunity.
However, I don’t anticipate a significant market correction lurking around the corner. Any dips are likely to be shallow. Institutional investor positioning remains underweight relative to broader index price levels. U.S. Fundamental Long/Short Hedge Fund net exposure currently stands at 51.9%, placing it in the 38th percentile on a one-year look-back, the 41st percentile on a three-year basis, and the 30th percentile over five years. Meanwhile, U.S. Equity Mutual Funds are holding $170 billion in cash, which is consistent with historical averages despite the market being at record highs.
This year, there’s been heightened chatter about poor September seasonality, more so than in previous years. Historically, when investors anticipate dips, they often fail to materialize. Recent market fluctuations have been quickly met with robust retail and corporate demand—two of the most significant drivers of the U.S. equity market this year.
Friday’s jobs data came in softer than expected but not weak enough to derail the ongoing retail buying frenzy. This enthusiasm is evident in the surge of penny stock trading volumes, crypto price movements, and the excitement surrounding high-profile IPOs in sectors like crypto, AI, and space exploration. The IPO market, particularly in the U.S. ECM space, is currently undergoing a full reopening. For context, we believe job losses are the primary factor that could disrupt retail demand, which is why we’re closely monitoring employment data.
Corporations have authorized $1.35 trillion in share buybacks this year—the highest ever—and are on track to execute $1.1 trillion in 2025, another record. With the year’s runway quickly narrowing, there’s still a significant wall of worry for the market to overcome. I’m watching for long-term investors who’ve been hesitant to begin taking positions in the market. Historically, a combination of rate cuts (we expect three before 2026), a weaker USD, solid earnings, and a stable economy with no recession has proven to be a favorable mix for the stock market. This time should be no different.
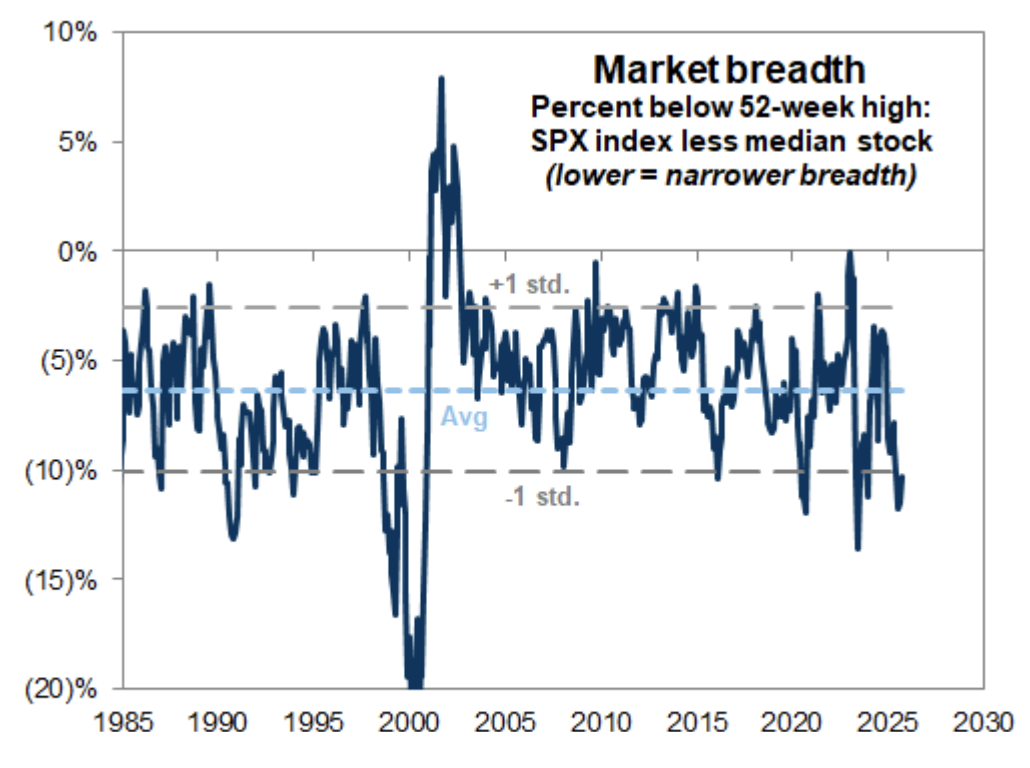
Market breadth remains narrow, signaling further opportunities for "catch-up" trades in lagging areas of the market. Our market breadth indicator is near one of its lowest levels in two decades. While the S&P 500 index is slightly below its peak, the median constituent is still 11% below its 52-week high.
Disclaimer: The material provided is for information purposes only and should not be considered as investment advice. The views, information, or opinions expressed in the text belong solely to the author, and not to the author’s employer, organization, committee or other group or individual or company.
Past performance is not indicative of future results.
High Risk Warning: CFDs are complex instruments and come with a high risk of losing money rapidly due to leverage. 71% and 74% of retail investor accounts lose money when trading CFDs with Tickmill UK Ltd and Tickmill Europe Ltd respectively. You should consider whether you understand how CFDs work and whether you can afford to take the high risk of losing your money.
Futures and Options: Trading futures and options on margin carries a high degree of risk and may result in losses exceeding your initial investment. These products are not suitable for all investors. Ensure you fully understand the risks and take appropriate care to manage your risk.
Patrick has been involved in the financial markets for well over a decade as a self-educated professional trader and money manager. Flitting between the roles of market commentator, analyst and mentor, Patrick has improved the technical skills and psychological stance of literally hundreds of traders – coaching them to become savvy market operators!